This article will guide you on how to create a traffic bill in librenms, specifically a quota-based bill, which can be used to track the total traffic usage of a specific port or multiple ports.
Why you might need this? I was asked by a customer to develop a solution to capture traffic-usage for virtual servers running on a Proxmox server. This led me to research available options and librenms seemed to fit the criteria perfectly. Sure, it does way more than I actually needed, but to have all the metrics from a bare-metal deployment in one location was one more reason to deploy it. You can read more about the use cases and get documentation here: https://www.librenms.org/.
This said, let’s get started. But we need some background in how proxmox does it’s networking. In order for KVMs (and LXC Containers) to have internet access, they need some network interface. Because proxmox need it’s own metrics to display on the overview page for the Container/VM, there are a number of different interfaces generated.
We will be tracking the traffic on 2 types of interfaces, depending if you are using LXC or KVM:
| Interface name | Description |
| veth<vmid>i<interface> | LXC network interfaces |
| tap<vmid>i<interface> | KVM network interfaces |
So when I create a new VM with the ID 104 (which I did in the following examples) we will get a new interface called “tap104i0”. If we decide to add a second interface (to get a second IP to the VM for example) we would get “tap104i1” and so on.
If I create a container with the ID 100 we will get a interface called “veth100i0”. If we add more interfaces it will be the same as for the KVM interfaces.
Now when we check in out librenms device, we can see all the ports that are available on that device, which in our case should at least be those 2 described above.
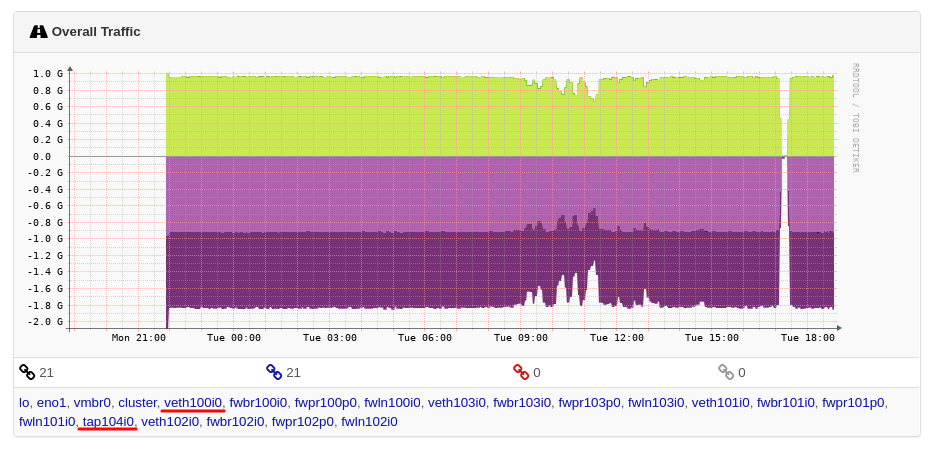
As you can see, I have a lot more interfaces, but these are either from different containers/vms or network adapters used by the firewall to better get detailed insights on how much traffic is used where and the actual filtering of the firewal rules. I will not go into detail on how proxmox networks work exactly, because this is about librenms.
So when we click on a port there, we are redirected to the ports-stats page. This is where we are able to see a lot of data and graphs about that one port. So we have the option to view traffic in real-time, can have a look at the ARP-Table and so on so on. We also get information on the current bandwidth that the port uses, indicated by the small arrows on the top.
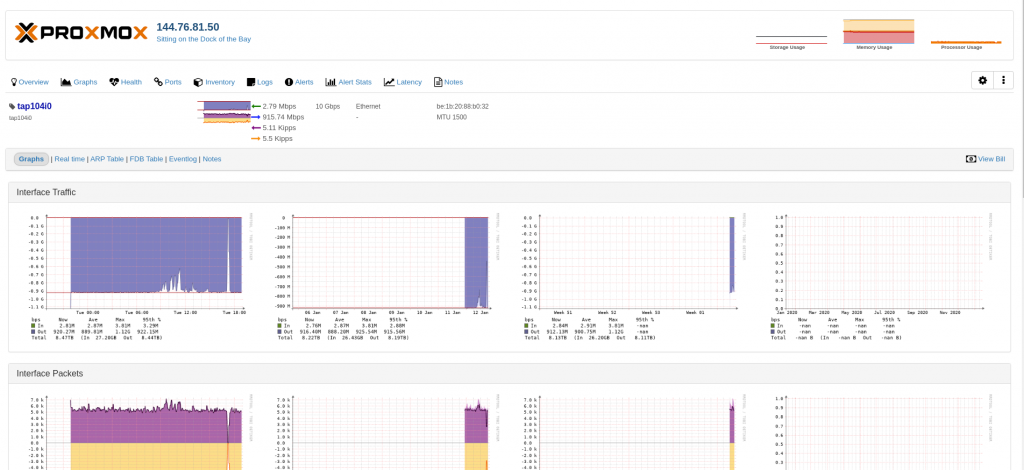
Be aware, that updating this graph can take some time, so dont get rushed and try to change something (unless you really know what you are doing, I’ve been there, trust me).
So let’s create a bill. Navigate in the top-bar under Ports –> Traffic Bills.
You should see nothing in the list (why would you be here otherwise right?). So you can click “Create Bill” in the top-left corner. This will open up a dialog to create a new bill.
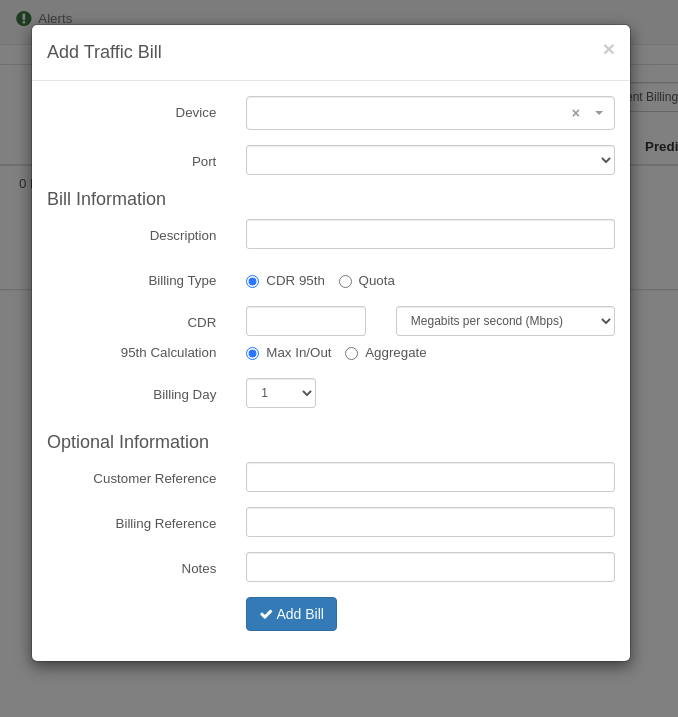
So device and port are both dropdown. You have to select the device where the port is located and then the port you actually want to have billed. You can always change that later or even add multiple ports into one bill.
The description is totally up to you, but I recommend setting it, since otherwise you wont be able to open the bill unless you take the route over the settings. I usually label my Bills “VMID: 104” for example, which mean that it’s the VM with the ID 104 in Proxmox. For LXC I would use “LXCID: 100”. As said, this is up to you.
Next up is the billing type, here you can decide how you want to monitor. Quota just looks at the total traffic used by the port, while “CDR 95th” looks at the 95% average (to put it simple), which will monitor the total bandwidth used, throw away the top 5% and then calculate the average for the remaining “low”-95%, hence the name. This can also be called “burstable billing” which would enable you to bill a customer for the bandwidth he used but be a little bit more forgiving regarding spikes he may has.
Anway, since we want to have quota-based billing, we will select “Quota”. Now the input switches and we can enter a number and select the appropriate unit. For demonstration I will use 2 TB.
The billing day is the day of the month at which the current billing-period starts and ends. So if you are creating the bill on the 25th of December you want your customer to still use the 2TB in his 1-month billing period, so you would select “25”. Then his billing-period starts on the 25th and ends on the 25th.
“Customer Reference”, “Billing Reference” and “Notes” are all optional fields where you can put in whatever you want. Either an invoice-id or a customer-id. Just whatever you feel would be needed there. Or you just leave them empty, that’s fine as well.
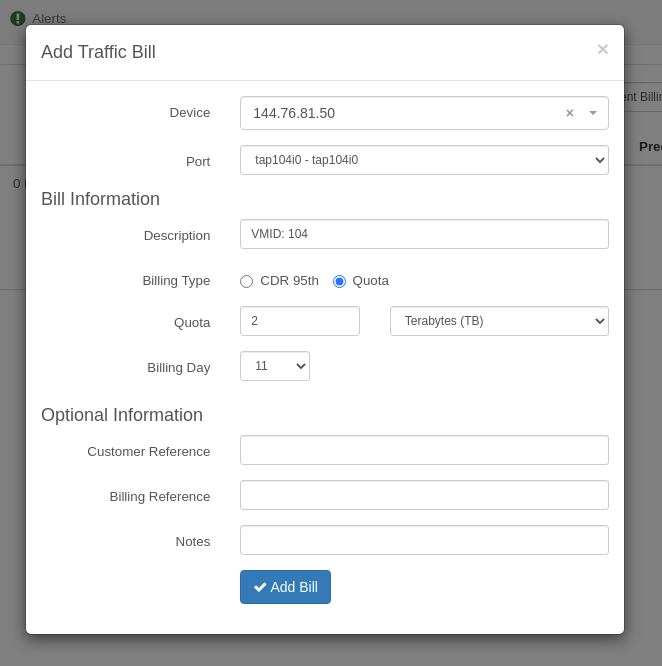
So now we can click the button “Add Bill” and open the bill.
So on this overview page, we get a lot more information. Always keep in mind, that the data updating can take up to 1 hour (in a default install it’s 1 minute after each full hour I think). So while some graphs may show correct (or current) data, others might not.
The “Bill Summary” is pretty much what you would expect from a summary. It shows how the customer has used of his quota and even has a small calculation which predicts the end-usage at the end of the billing period, so you can maybe alert your customers early if they are about to hit the limit in the current period.
The part that is most important for us is in the part “Transfer Graphs”. This will show the total transferred, inbound AND outbound traffic for the port(s).
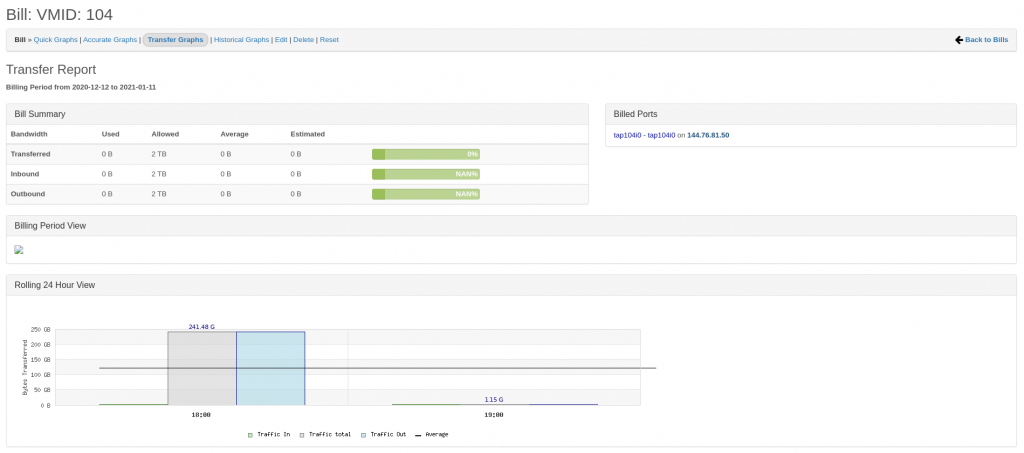
As you can see, the bottom graph shows some 115 Gigabytes of traffic but the summary above stays empty. This is because the bill-data is not regenerated yet. Due to the performance of the calculation that takes places when the bill is calculated (data is moved from the port to the bill and limits are calculated (maybe even overflow) this is not run often or on demand, since it would take up many resources. This is not a problem in smaller enviorments, but once you scale to a few-hundered devices you really have to think about stuff like that.

This view here shows you the current, average and maximum bandwidth that is used by the port. When you see big numbers here (bigger than 10Mbps) and you do not see them reflected in the billing itself or the transfer graphs, be sure to check the following:
Obiously check that you attached the correct port. Sometimes there are two with the same name, which are not clearly marked during bill-creation.
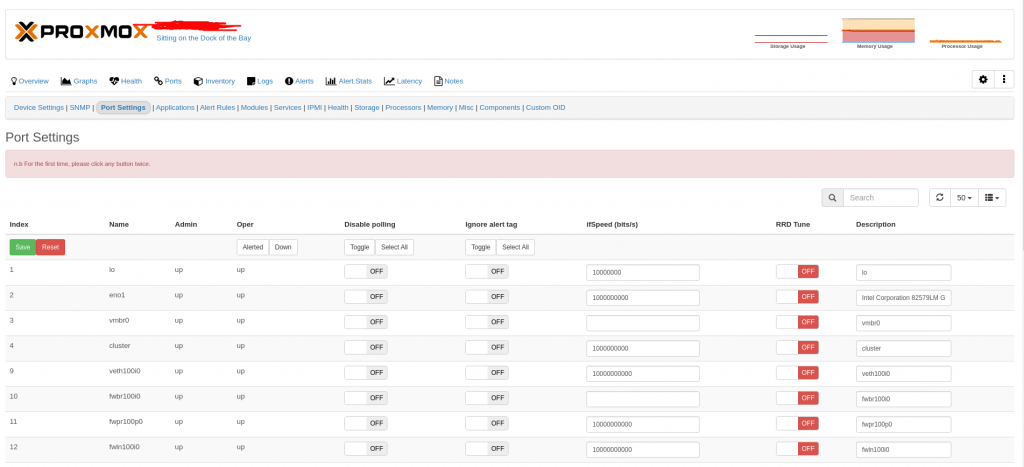
Also make sure that the “IfSpeed” here is more than the speed that the interface is using in your bill.
For some reason when the interfaces are created in proxmox and then imported into librenms, they are marked as 10mbs ports, which makes no sense, because you can send/receive much more than that (unless you don’t have a limit set in proxmox of course).
The guys who are developing this implemented a series of precautions that prevent “weird” or unclean data from entering the bill itself, so what happens is this:
- It reads the current port-usage (total transferred bits)
- It gets the last value from the database and calculates a delta (current – previous)
- This then get’s checked against the port-speed itself, so if you have a 10mbs port and libre calculates an average bandwidth-usage of 100mbs this is obviously impossible, since you cannot use more than you have available.
If that happens (which is likely) make sure to manually set the interface-speed of the port to the interface-speed of you main network-adapter on the box, since that is the absolute maximum the port can use.
So now we have successfully created a bill and are now able to track traffic-usage of single ports.
Btw.: LibreNMS is a great tool. It uses the SNMP (Simple Network Monitoring Protocol) which basically all modern network devices come equiped with like modems, switches, access points, etc. Linux has the snmpd package, which allows you to monitor servers over SNMP. Make sure you visit the Website and star the GitHub Repo!


